What should one trace prove after an agent run goes wrong?
The tempting answer is to record the model call and the final answer. That answer is not useless, but it is too vague to operate. Agent tracing records the ordered steps of an agent run: workflow identity, model calls, tool calls, handoffs, context packets, guardrails, evals, approvals, costs, errors, and final side effects. A useful trace proves what happened and why the system allowed it.
Direct answer
Agent tracing records the ordered steps of an agent run: workflow identity, model calls, tool calls, handoffs, context packets, guardrails, evals, approvals, costs, errors, and final side effects. A useful trace proves what happened and why the system allowed it.
The common mistake
The sharper operating question is:
Where this gate sits
Tracing is the event spine under observability, monitoring, evaluation, and approval. If the trace is missing, every other gate becomes a claim instead of evidence.
Signals to capture
| Signal | What to inspect | Gate action |
|---|---|---|
| Workflow | Name, run ID, user, session | Group the run |
| Generation | Model, prompt ref, output ref, tokens | Explain model step |
| Tool call | Tool, args ref, result ref, side effect | Explain execution |
| Guardrail/eval | Rule, score, pass/fail, action | Explain control |
| Approval | Reviewer, packet, decision, timestamp | Explain escalation |
Running example
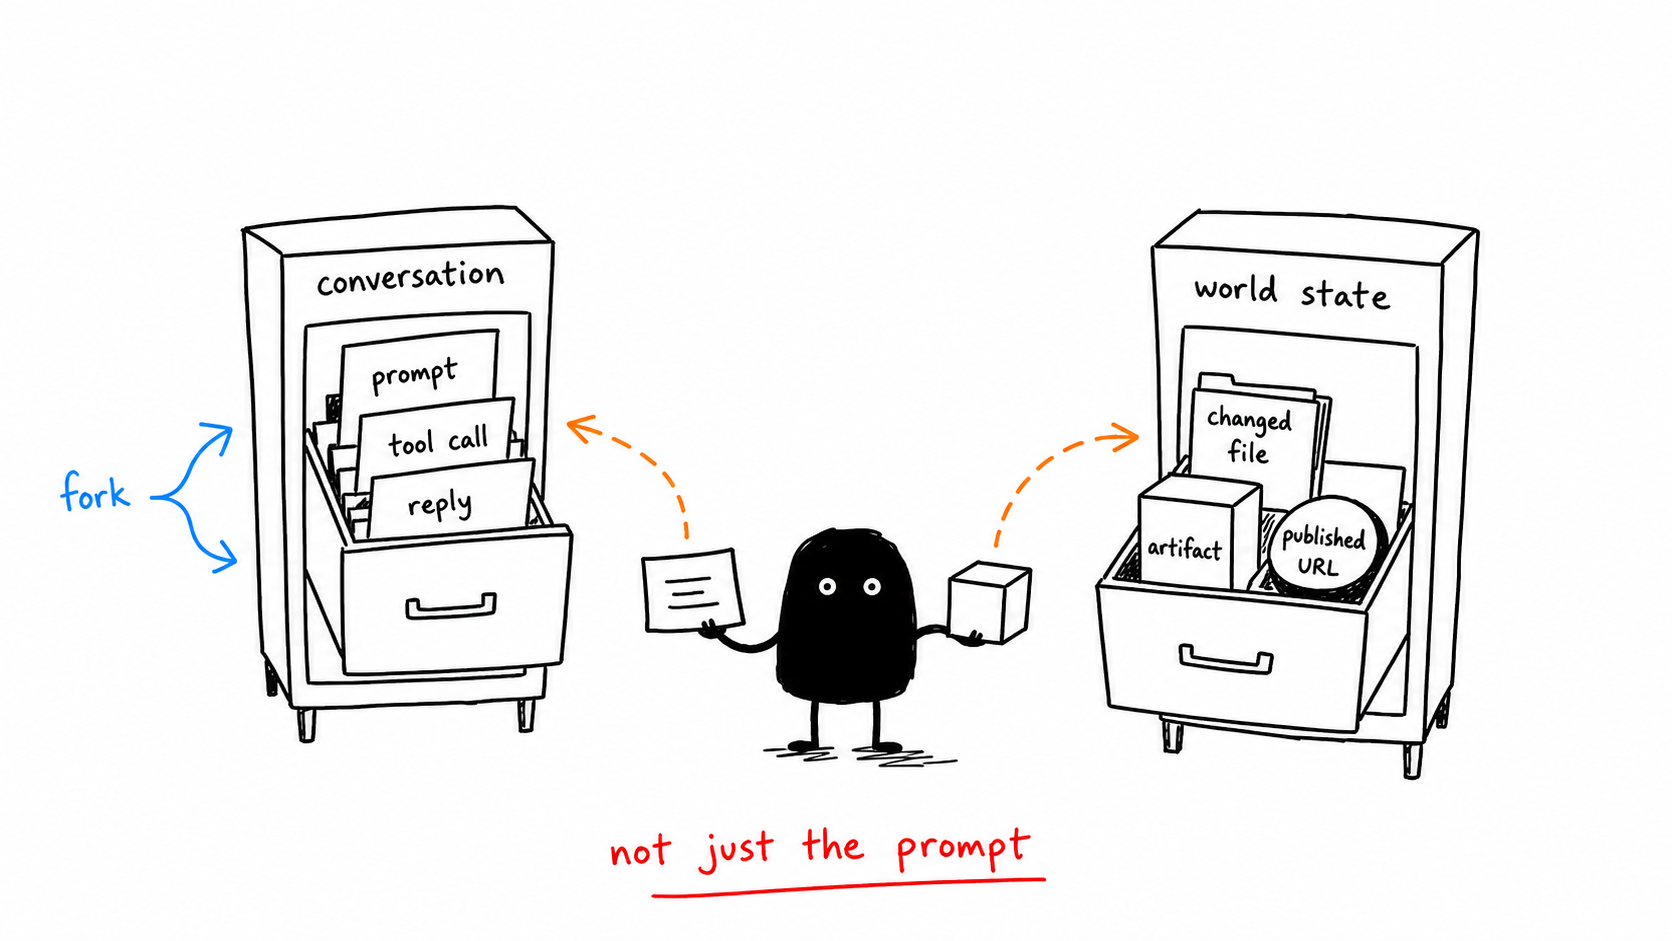
A coding agent edits a config file and deploys. The useful trace links the user request, repo state, files read, patch applied, tests run, deployment command, approval event, and final live check. Without that chain, the team only knows a deploy happened.
Implementation checklist
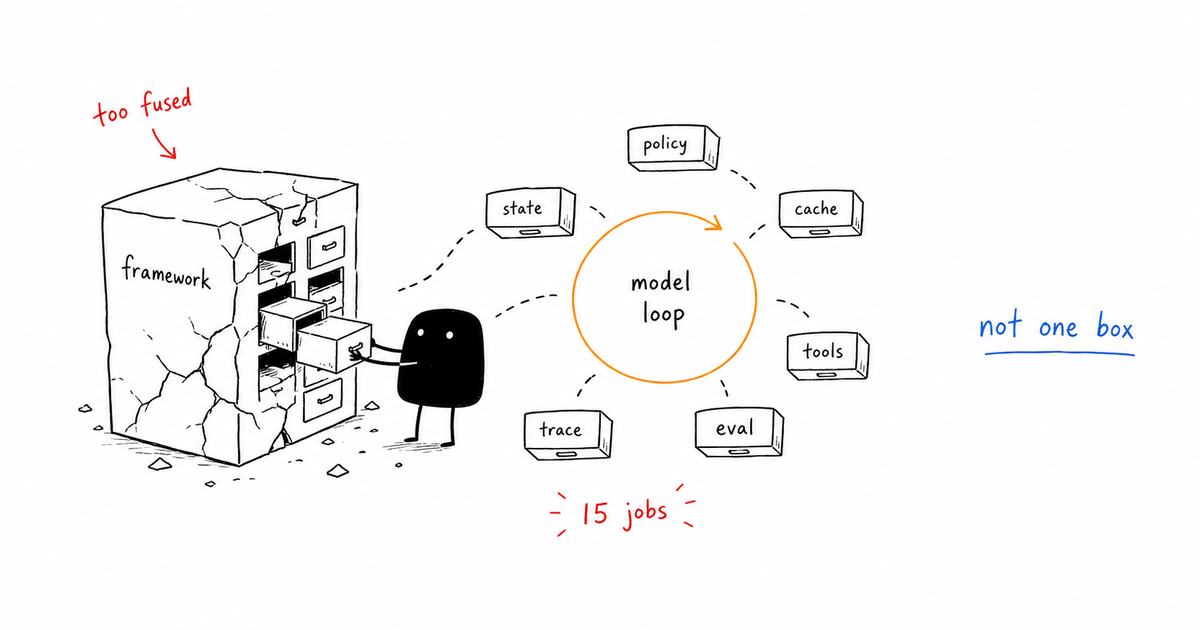
- Trace the whole workflow, not only individual model calls.
- Use parent-child spans for agent handoffs and tool calls.
- Store references for sensitive inputs instead of dumping secrets into logs.
- Record control decisions as spans with outcomes.
- Make the final side effect point back to the trace ID.
What changes in production
In a demo, Agent tracing can look like a reviewer preference. In production, it has to become a branch in the agent runtime.
The branch is simple: if the system sees “Name, run ID, user, session”, it should group the run. If it sees “Model, prompt ref, output ref, tokens”, it should explain model step. If it hits “A mutation has no parent trace”, the run should not continue as if nothing happened.
For Agent tracing, that is the difference between a content checklist and a control gate. The gate changes the next action while the run is still alive.
What to log in the trace
trace_idspan_idworkflow_nametool_nameside_effect_classguardrail_spanapproval_span
Review packet
A reviewer, on-call owner, or future incident review should be able to answer three Agent tracing questions from the packet:
- What evidence triggered this Agent tracing gate?
- What action did this Agent tracing gate allow, deny, retry, or escalate?
- What would have happened if the Agent tracing gate had been absent?
For Agent tracing, the packet should point directly at the trace fields above and the specific signal row that caused the decision. If the packet only says “agent requested approval” or “policy failed,” it is not yet operational evidence.
When to escalate
- A mutation has no parent trace.
- A retry could duplicate side effects.
- A trace contains secrets rather than redacted references.
- Approval cannot be joined to the action it approved.
Related control gates
- Agent Observability: Trace What Agents Decide and Do
- AI Agent Monitoring: Metrics, Logs, and Stop Conditions
- AI Agent Evaluation: Gates That Catch Bad Behavior
- Human Approval for AI Agents: When Agents Should Stop
- AI Agent Control Gates: Stop Bad Agents Before They Act
Frequently Asked Questions
What is agent tracing?
Agent tracing is the structured record of an agent run across model calls, tool calls, context, guardrails, evals, approvals, and outcomes. It gives every important step a place in the evidence chain.
What should an agent trace include?
At minimum, include workflow name, trace ID, spans for model and tool operations, context references, policy outcomes, costs, errors, approvals, and final side effects.
How is tracing different from logging?
Logs are messages. Traces connect operations into a causal path. For agents, that path matters because the failure often comes from interactions between context, tools, retries, and approvals.
The Takeaway
A trace is not a performance artifact. It is the receipt for every decision that let the agent touch the world.